Telangana Human Development index
- Human development is a process of enlarging people’s choices. But human development is also the objective, so it is both a process and an outcome.
- Human development implies that people must influence the processes that shape their lives. In all this, economic Growth is an important means to human development, but not the end.
- Human development is the development of the people through building human capabilities, by the people through active participation in the processes that shape their lives and for the people by improving their lives.
- It is broader than other approaches, such as the human resource approach, the basic needs approach and the human welfare approach.
- The composite Human Development Index (HDI) integrates three basic dimensions of human development. Life expectancy at birth reflects the ability to lead a long and healthy life. Mean years of schooling and expected years of schooling reflect the ability to acquire knowledge. And gross NATIONAL INCOME per capita reflects the ability to achieve a decent standard of living
- To measure human development more comprehensively, the Human Development Report also presents four other composite indices.

- The Inequality-adjusted HDI Discounts the HDI according to the extent of inequality. The Gender Development Index compares female and male HDI values.
- The Gender Inequality Index highlights Women’s Empowerment. And the Multidimensional POVERTY Index measures nonincome dimensions of poverty
Human development—a people-centred approach
- Human development is about acquiring more capabilities and enjoying more opportunities to use those capabilities. With more capabilities and opportunities, people have more choices, and expanding choices is at the core of the human development approach. But human development is also a process.
- Anchored in Human Rights, it is linked to human security. And its ultimate objective is to enlarge human freedoms. Human development is development of the people through the building of human Resources, for the people through the translation of development benefits in their lives and by the people through active participation in the processes that influence and shape their lives.
- Income is a means to human development but not an end in itself. The human development approach in the 1990 Human Development Report also introduced a composite index, the Human Development Index (HDI), for assessing achievements in the basic dimensions of human development. Those dimensions of human development are to lead a long and healthy life, measured by life expectancy at birth; to acquire knowledge, measured by mean years of schooling and expected years of schooling; and to achieve a decent standard of living, measured by gross national income per capita.
Life Expectancy at Birth
- The indicator of life expectancy at birth is used to measure the realised achievement in the Health dimension, that is, ‘to be able to live a long life’.
- The life expectancy at birth denotes the number of years that a child can expect to live at the time of birth, given the agespecific mortality rates in the Population.
- The life expectancy, however, is an indicator of very long-term improvement in health.
Mean Years of Schooling
- Mean Years of Schooling (MYS) is one of the two indicators used to measure educational achievement in HDRs by UNDP.
- It replaced the Literacy rate as an indicator under the Education dimension in 2010. MYS indicates the Average number of completed years of education of a country’s population.
- Usually, MYS is estimated for populations aged 25 years and older, which is also the indicator used in the calculation of the HDI by UNDP
Expected Years of Schooling
- EYS is a measure of the number of years of schooling a child at the start of his or her education is expected to receive, if current rates of enrolment are maintained throughout the child’s life.
Income Per Capita
- Income per capita is considered as an ‘indirect’ indicator of human development. The first HDR of UNDP (1990) observes that an indicator of ‘command over resources needed for a decent living’ requires data on access to land, credit, income and other sources.
- In 2010, instead of GDP per capita, Gross National Income (GNI) per capita is taken as the indicator.
- For allowing cross-country comparison, the GNI per capita of the countries was adjusted by Purchasing Power Parity (PPP) ratios.
Facts Related to Talengana
Health Dimension of Human Development in Telangana
- The Infant Mortality Rate (IMR) is an important component of mortality indicating the health status of the newborn. The Infant Mortality Rate at the State level was 43 in 2011.
Maternal Mortality Rate
- The Maternal Mortality Rate (MMR) is a sensitive indicator reflecting the availability of health care facilities and the prevailing socio-economic scenario.
- The Maternal Mortality Ratio (MMR) is defined as the number of maternal deaths during pregnancy or within 42 days after the termination of pregnancy per one lakh live births during a year.
- The estimates of maternal mortality are required not only to capture the reproductive health status of women but also to get an idea of the adequacy of maternal Services provided to women.
- One of the major goals of MDG (2000) and national goals has been to bring down the MMR to 100 per lakh births by 2012.
- Socio Economic Outlook 2016 98 According to the data released by the Ministry of Health and Family Welfare, the MMR in Telangana was 92 per lakh births in 2011-13.
Nutritional Status
- Nutritional status is a major determinant of the health and well-being of children.
- Inadequate or unbalanced diets and chronic illness are associated with poor Nutrition among children. Percentage of children below age five classified as malnourished according to three anthropometric indices of nutritional status (height for age, weight for height and weight for age).
- According to DLHS-4 (2012-13), the lowest rate stunting was reported in Warangal district (12%) followed by Nalgonda (18%). However, the highest rate of stunting was recorded in Mahabubnagar (34%), followed by Nizamabad (33%), and Hyderabad (29%).
Total Fertility Rate
- The pace of decline in fertility was slower till the first half of the 1980s but thereafter there has been a rapid decline in fertility in Telangana.
- The decline in fertility was achieved primarily through contraceptive use almost solely through female sterilization. District-wise total fertility rate projections indicated that a woman in Telangana State, on an average, had 1.8 children in her lifetime.
- The districts which reported fertility rates over and above replacement level were Medak (2.2) and Mahabubnagar (2.4) in 2013. It is to be noted that fertility differences have narrowed down considerably among women with a higher level of education and women across locations and social groups.
Economic Dimension
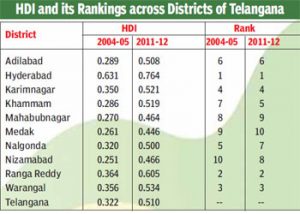
- Medak, Rangareddy and Hyderabad attained a higher growth of Gross District Domestic Product (GDDP) than that of the State during 2004-2011.
- Except Medak the other two districts have shown higher level of HDI values with ranks 2nd and 1st respectively. Despite the achievement of the highest growth in GDDP, Medak was ranked the lowest in human development in 2011-12.
- This may be because the higher growth in Medak may not have resulted in improvements in household consumption.
- The growth of GDDP in Nalgonda, Nizamabad and Karimnagar districts was slightly lower than that of State. Out of these three districts, only Karimnagar had achieved a higher level of HDI with a rank of 3 in 2011-12.
- Mahabubnagar, Khammam, Warangal and Adilabad achieved growth rates of GDDP ranging from 8 to 10 percent, lower that of the State. These districts, except Mahabubnagar, achieved a middle level of human development. Thus, economic growth has not shown any signifi cant impact on the level of human development across the districts of Telangana State.
Health Dimension
Gender Gap in Literacy Rates
- The gender gap is the main contributor to low literacy. At the State level, the female literacy rate was only 57.9 per cent as against 75.0 per cent among males in 2011, indicating a gap of 17.1 percentage points.
- Mahbubnagar, Nalgonda, Adilabad, Nizamabad and Medak have shown a higher gender disparity of 20 percentage points
Literates with Primary and above level
- Around 79 percent of males and 78 percent of females were literates with primary and above level schooling in the State during 2011.
- There was not much difference between males and females. The gap between rural Socio Economic Outlook 2016 105 and urban areas was 7 percentage points.
- The percentage of literates with primary and above level of education exceeded 80 percent in Hyderabad, Rangareddy, Karimanagar and Warangal districts. With respect to women, this percentage was higher than 80 percent only in Hyderabad and Rangareddy.
Literacy among 15-24 age Population
- Around 87 percent of persons in the age group of 15-24 were literates at the State level in 2011. The proportion among males was 91.1 percent and among females it was 87 percent.
- The gender gap was 4.1 percentage points at the State level.
- However, it was more than 10 percentage points in Mahabubnagar, Nalgonda, Medak and Adilabad districts.
- The same districts have also shown a higher rural-urban gap in the literacy rates of persons in this age group
The drop-out rate at the primary level
- The drop-out rate at the primary level in the State was 23.1 percent during 2011-12.
- The drop-out rate among STs was 35.8 percent, higher than that of SCs and all social groups. The drop-out rates were lower among SCs as compared to all social groups and STs. This is the case among boys and girls.
- For all social groups, the drop-out rates for both male and female were higher than the State average in Adilabad, Mahabubnagar, Medak, Nalgonda and Warangal. The same is the case with STs also.
Primary Completion among children of 12 years old
- The proportion of children of 12 years completing primary education was 67 percent according to 2011 Census.
- The percentage of boys was 68 and that of girls was 66 percent with reference to the completion of primary education.
- The proportion of children both boys and girls who had completed primary education was the lowest in Hyderabad with 57 percent.
- The percentage of children who had completed primary was higher in rural than in urban areas. However, the percentage was higher in urban areas in Adilabad, Khammam and Mahabubnagar districts.
Conclusion
- HDI and its components have improved over a period of time across all the districts of Telangana.
- The analysis reflects declining inequalities and exhibits convergence of HDI across the districts.
- However, it is indicated that economic growth has no direct linkages with the level of human development.
- Districts with a high rate of economic growth have shown low value of HDI.
- Economic growth in those districts has not necessarily benefi tted the local population and thus not resulted in improving their living standards.
- However, growth in Monthly Percapita Consumption Expenditure (MPCE) has strong linkages with the level of human development.
- It is also evident that the level of public expenditure and its effi cient utilisation along with other factors infl uences the human development
21st century skills
| Ways of thinking | Tools for working | Ways of working | Skills for living in the world |
| Creativity Critical thinking Problem solving | Communication-technology/”>Information and communication technology Information literacy | Communication Collaboration | Citizenship-2/”>Citizenship Life and career Personal and social responsibility |
,
The Human Development Index (HDI) is a composite statistic of life expectancy, education, and per capita income indicators, which are used to rank countries into four tiers of human development. A country’s HDI value is a summary measure of its achievements in key areas of human development: a long and healthy life, being knowledgeable, and having a decent standard of living. The HDI is used to rank countries and track their progress over time.
Telangana is a state in India that was formed in 2014. It is the 12th largest state in India by area and the 10th most populous state. The capital of Telangana is Hyderabad.
The HDI for Telangana in 2020 was 0.734, which is in the high human development category. Telangana’s HDI rank in 2020 was 130 out of 189 countries. Telangana’s HDI has been increasing steadily over the past few years. In 2010, Telangana’s HDI was 0.641, which is in the medium human development category.
The three components of the HDI for Telangana are life expectancy at birth, mean years of schooling, and expected years of schooling. Life expectancy at birth in Telangana in 2020 was 72.1 years. Mean years of schooling in Telangana in 2020 was 10.9 years. Expected years of schooling in Telangana in 2020 was 12.9 years.
The HDI inequality-adjusted value for Telangana in 2020 was 0.675. This means that Telangana’s HDI would be 0.675 if there were no inequality in the distribution of income. The HDI inequality-adjusted rank for Telangana in 2020 was 135 out of 189 countries.
The three components of the HDI inequality-adjusted value for Telangana are life expectancy at birth inequality-adjusted, mean years of schooling inequality-adjusted, and expected years of schooling inequality-adjusted. Life expectancy at birth inequality-adjusted in Telangana in 2020 was 71.8 years. Mean years of schooling inequality-adjusted in Telangana in 2020 was 10.7 years. Expected years of schooling inequality-adjusted in Telangana in 2020 was 12.7 years.
Telangana has made significant progress in human development over the past few years. The HDI for Telangana has been increasing steadily, and the state is now in the high human development category. However, there is still significant inequality in the distribution of income in Telangana. The HDI inequality-adjusted value for Telangana is lower than the HDI value, which indicates that there is inequality in the distribution of income in the state.
The government of Telangana has taken steps to address the issue of inequality. The state has implemented a number of programs to improve access to education and healthcare, and to reduce poverty. The government has also implemented a number of programs to promote economic growth and development.
The government of Telangana is committed to improving the lives of all its citizens. The state is working to reduce inequality and to improve the Quality Of Life for all its citizens.
What is the Human Development Index (HDI)?
The Human Development Index (HDI) is a composite statistic of life expectancy, education, and per capita income indicators, which are used to rank countries into four tiers of human development. A country’s HDI value is a summary measure of its achievements in key areas of human development: a long and healthy life, being knowledgeable, and having a decent standard of living.
What are the components of the HDI?
The HDI is calculated using three indicators: life expectancy at birth, mean years of schooling, and expected years of schooling, and per capita income.
How is the HDI calculated?
The HDI is calculated using the following formula:
HDI = (longevity * education * income) / 3
Where:
- longevity is measured by life expectancy at birth
- education is measured by mean years of schooling and expected years of schooling
- income is measured by per capita income
What are the limitations of the HDI?
The HDI has been criticized for a number of reasons, including the following:
- It does not take into account inequality within countries.
- It does not take into account non-economic factors such as political freedom and environmental sustainability.
- It is based on a limited number of indicators.
What are some alternative measures of human development?
Some alternative measures of human development include the following:
- The Inequality-Adjusted Human Development Index (IHDI)
- The Gender Development Index (GDI)
- The Multidimensional Poverty Index (MPI)
What is the difference between the HDI and the IHDI?
The HDI is a measure of average achievement in key areas of human development, while the IHDI is a measure of the average achievement in key areas of human development after adjusting for inequality.
What is the difference between the HDI and the GDI?
The HDI is a measure of human development for all people in a country, while the GDI is a measure of human development for women in a country.
What is the difference between the HDI and the MPI?
The HDI is a measure of human development, while the MPI is a measure of multidimensional poverty.
What are some of the challenges to human development?
Some of the challenges to human development include the following:
- Poverty
- Inequality
- Disease
- Conflict
- Environmental Degradation
What are some of the opportunities for human development?
Some of the opportunities for human development include the following:
- Economic growth
- Technological Progress
- Social progress
- Political progress
- Environmental protection
The Human Development Index (HDI) is a composite statistic of life expectancy, education, and per capita income indicators, which are used to rank countries into four tiers of human development. Which of the following is not one of the indicators used to calculate the HDI?
(A) Life expectancy at birth
(B) Mean years of schooling
(C) Expected years of schooling
(D) Gross national income per capitaThe HDI was developed by the United Nations Development Programme (UNDP) in 1990. Which of the following is not one of the goals of the HDI?
(A) To help countries assess their progress in improving the quality of life for their citizens
(B) To help countries compare their performance with that of other countries
(C) To help countries identify areas where they need to improve
(D) To help countries set targets for improving the quality of life for their citizensThe HDI is calculated using a formula that gives equal weight to each of the three indicators. Which of the following is not one of the assumptions of the HDI?
(A) The three indicators are equally important for measuring human development
(B) The three indicators are equally correlated with each other
(C) The three indicators are equally distributed across countries
(D) The three indicators are equally affected by government policiesThe HDI has been criticized for a number of reasons. Which of the following is not one of the criticisms of the HDI?
(A) The HDI is too simplistic and does not capture the full range of human development
(B) The HDI is biased towards developed countries
(C) The HDI is not sensitive to changes in the distribution of income
(D) The HDI is not sensitive to changes in the quality of lifeThe HDI has been used to track progress in human development over time. Which of the following is not one of the findings of the HDI?
(A) There has been significant progress in human development over the past few decades
(B) The gap between developed and developing countries has narrowed
(C) The gap between rich and poor within countries has widened
(D) The HDI has been relatively stable over the past few decadesThe HDI has been used to compare the performance of different countries. Which of the following is not one of the findings of the HDI?
(A) Norway has the highest HDI in the world
(B) Switzerland has the second highest HDI in the world
(C) Canada has the third highest HDI in the world
(D) The United States has the 15th highest HDI in the worldThe HDI has been used to set targets for improving human development. Which of the following is not one of the Millennium Development Goals (MDGs)?
(A) To eradicate extreme poverty and hunger
(B) To achieve universal primary education
(C) To promote Equality/”>Gender Equality and empower women
(D) To reduce child mortalityThe HDI has been used to track progress towards the MDGs. Which of the following is not one of the findings of the HDI?
(A) There has been significant progress in reducing poverty and hunger
(B) There has been significant progress in achieving universal primary education
(C) There has been significant progress in promoting gender equality and empowering women
(D) There has been significant progress in reducing child mortalityThe HDI has been used to develop new indices to measure human development. Which of the following is not one of the new indices?
(A) The Inequality-adjusted Human Development Index (IHDI)
(B) The Gender Development Index (GDI)
(C) The Human Poverty Index (HPI)
(D) The Multidimensional Poverty Index (MPI)The HDI has been used to promote human development. Which of the following is not one of the ways in which the HDI has been used to promote human development?
(A) The HDI has been used to raise awareness of the importance of human development
(B) The HDI has been used to advocate for policies that promote human development
(C) The HDI has been used to monitor progress in human development
(D) The HDI has been used to evaluate the impact of development programs