Probability
Probability is simply how likely something is to happen.
Whenever we’re unsure about the outcome of an event, we can talk about the probabilities of certain outcomes—how likely they are. The analysis of events governed by probability is called statistics.
Tossing a Coin
When a coin is tossed, there are two possible outcomes:
heads (H) or tails (T)
We say that the probability of the coin landing H is ½ And the probability of the coin landing T is ½.
Throwing Dice
When a single die is thrown, there are six possible outcomes: 1, 2, 3, 4, 5, 6.
The probability of any one of them is 16
Number of ways it can happen
Probability of an event happening = ________________________
Total number of outcomes
Data science often uses statistical inferences to predict or analyze trends from data, while statistical inferences uses probability distributions of data. Hence knowing probability and its applications are important to work effectively on data science problems.
Permutation is the different arrangements of a given number of Elements taken one by one, or some, or all at a time. For example, if we have two elements A and B, then there are two possible arrangements, AB and BA. While on the other hand Combination means selection of things. The word selection is used, when the order of things has no importance.The study of permutations and combinations is concerned with determining the number of different ways of arranging and selecting objects out of a given number of objects, without actually listing them. There are some basic counting techniques which will be useful in determining the number of different ways of arranging or selecting objects. The two basic counting principles are given below:
Fundamental principle of counting
Multiplication principle (Fundamental Principle of Counting) Suppose an event E can occur in m different ways and associated with each way of occurring of E, another event F can occur in n different ways, then the total number of occurrence of the two events in the given order is m × n .
Addition principle
If an event E can occur in m ways and another event F can occur in n ways, and suppose that both can not occur together, then E or F can occur in m + n ways.
Number of permutations of ‘n’ different things taken ‘r’ at a time is given by:-
nPr = n!/(n-r)!
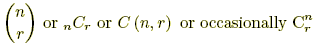
The number of possible combination of r objects from a set on n objects.
,
Probability is the branch of mathematics that deals with the likelihood of events occurring. It is used in a wide variety of fields, including statistics, gambling, and insurance.
Basic probability is the study of simple events, such as the probability of rolling a 6 on a die. Conditional probability is the study of the probability of one event occurring given that another event has already occurred. Independent events are events that do not affect each other’s probability of occurring. Bayes’ theorem is a formula that can be used to calculate the probability of an event occurring given the probability of other events occurring.
Random variables are quantities that can take on different values, such as the number of heads that come up in 10 coin flips. Probability distributions are functions that describe the probability of a random variable taking on different values. Expected value is the Average value of a random variable. Standard deviation is a measure of how spread out the values of a random variable are.
The normal distribution is a probability distribution that is often used to model real-world data. The binomial distribution is a probability distribution that is used to model the number of successes in a series of independent trials. The Poisson distribution is a probability distribution that is used to model the number of events that occur in a given time period. The geometric distribution is a probability distribution that is used to model the number of trials it takes to get one success. The hypergeometric distribution is a probability distribution that is used to model the number of successes in a sample of a Population. The negative binomial distribution is a probability distribution that is used to model the number of successes in a series of trials until a certain number of failures occurs.
The uniform distribution is a probability distribution that assigns equal probability to all possible values. The exponential distribution is a probability distribution that is used to model the time between events. The gamma distribution is a probability distribution that is used to model the time between events that occur at a constant rate. The Weibull distribution is a probability distribution that is used to model the time between events that occur at a decreasing rate. The Pareto distribution is a probability distribution that is used to model the distribution of wealth. The lognormal distribution is a probability distribution that is used to model the distribution of data that is skewed to the right. The beta distribution is a probability distribution that is used to model the probability of two events occurring.
The chi-squared distribution is a probability distribution that is used to test the goodness of fit of a model to data. The F-distribution is a probability distribution that is used to test the Equality of two variances. The Student’s t-distribution is a probability distribution that is used to test the difference between two means. The Kolmogorov-Smirnov test is a test that is used to compare two probability distributions. The chi-squared test is a test that is used to compare the observed frequencies of events to the expected frequencies of events. The F-test is a test that is used to compare the variances of two populations. The Student’s t-test is a test that is used to compare the means of two populations. The Wilcoxon signed-rank test is a test that is used to compare the means of two populations when the data are paired. The Mann-Whitney U test is a test that is used to compare the means of two populations when the data are not paired. The Kruskal-Wallis test is a test that is used to compare the means of three or more populations. The Friedman test is a test that is used to compare the means of three or more populations when the data are repeated measures.
One-way ANOVA is a test that is used to compare the means of three or more populations when the data are not related. Two-way ANOVA is a test that is used to compare the means of three or more populations when the data are related. MANOVA is a test that is used to compare the means of three or more populations on two or more variables. ANCOVA is a test that is used to compare the means of two populations while controlling for a third variable.
Logistic regression is a statistical method that is used to model the probability of an event occurring. Linear regression is a statistical method that is used to model the relationship between two variables. Poisson regression is a statistical method that is used to model the number of events that occur in a given time period. Cox proportional hazards regression is a statistical method that is used to model the risk of an event occurring. Survival analysis is a statistical method that is used to model the time until an event occurs.
Time series analysis is a statistical method that is used to analyze data that is collected over time. Spectral analysis is a statistical method that is used to analyze the frequency components of data. Chaos theory is a branch of mathematics that studies the behavior of complex systems. Fractals are geometric objects that are self-similar at all scales. Entropy is a measure of the disorder of a system. Information theory is a branch of mathematics that studies the transmission of information
What is the difference between a hypothesis and a theory?
A hypothesis is a tentative statement about the relationship between two or more variables. A theory is a well-substantiated explanation of some aspect of the natural world, based on a body of facts that have been repeatedly confirmed through observation and experiment.
What is the difference between correlation and causation?
Correlation is a measure of the strength of the relationship between two variables. Causation is a relationship between two variables in which one variable is the cause of the other. Just because two variables are correlated does not mean that one causes the other. For example, there is a correlation between ice cream sales and shark attacks. However, this does not mean that ice cream sales cause shark attacks. It is more likely that both ice cream sales and shark attacks are caused by a third variable, such as hot weather.
What is the difference between a population and a sample?
A population is the entire group of individuals that you are interested in studying. A sample is a subset of the population that you actually study.
What is the difference between a census and a survey?
A census is a survey that attempts to collect data from every member of the population. A survey is a survey that collects data from a subset of the population.
What is the difference between a descriptive statistic and an inferential statistic?
A descriptive statistic is a summary measure of a sample. An inferential statistic is a measure that is used to make inferences about a population based on data from a sample.
What is the difference between a confidence interval and a p-value?
A confidence interval is a range of values that is likely to contain the true value of a population parameter. A p-value is the probability of obtaining a result at least as extreme as the one observed if the null hypothesis were true.
What is the difference between a type I error and a type II error?
A type I error is the error of rejecting the null hypothesis when it is true. A type II error is the error of failing to reject the null hypothesis when it is false.
What is the difference between a one-tailed test and a two-tailed test?
A one-tailed test is a test in which the alternative hypothesis specifies a direction for the difference between the two groups. A two-tailed test is a test in which the alternative hypothesis does not specify a direction for the difference between the two groups.
What is the difference between a parametric test and a nonparametric test?
A parametric test is a test that assumes that the data are normally distributed. A nonparametric test is a test that does not assume that the data are normally distributed.
What is the difference between a continuous variable and a discrete variable?
A continuous variable is a variable that can take on any value within a given range. A discrete variable is a variable that can only take on certain values.
What is the difference between a nominal variable, an ordinal variable, and an interval variable?
A nominal variable is a variable that has no inherent order. An ordinal variable is a variable that has an inherent order, but the distances between the values are not meaningful. An interval variable is a variable that has an inherent order and the distances between the values are meaningful.
What is the difference between a bar graph, a histogram, and a line graph?
A bar graph is a graph that uses bars to represent the frequencies or relative frequencies of different categories. A histogram is a graph that uses bars to represent the frequencies or relative frequencies of continuous data. A line graph is a graph that uses a line to represent the values of a variable over time.
What is the difference between a scatter plot and a correlation coefficient?
A scatter plot is a graph that shows the relationship between two variables. A correlation coefficient is a measure of the strength of the relationship between two variables.
What is the difference between a mean, a Median, and a mode?
The mean is the average of a set of data. The median is the middle value in a set of data. The mode is the most common value in a set of data.
What is the difference between a standard deviation and a Variance?
The standard deviation is a measure of the spread of a set of data. The variance is a measure of the squared deviations from the mean.
What is the difference between a z-score and a t-score?
A z-score is a standardized score that indicates how many standard deviations a value is away from the mean. A t-score is a standardized score that indicates how many standard deviations a value is away from the mean, taking into account the sample size.
**What is the difference between a p
Sure, here are some MCQs without mentioning the topic Probability:
A coin is tossed 3 times. What is the probability of getting at least 2 heads?
(A) 1/8
(B) 3/8
(C) 5/8
(D) 7/8A bag contains 5 red balls and 3 blue balls. A ball is drawn at random. What is the probability of getting a red ball?
(A) 5/8
(B) 3/8
(C) 1/2
(D) 2/3A die is rolled. What is the probability of getting a number greater than 3?
(A) 1/6
(B) 1/2
(C) 2/3
(D) 5/6A card is drawn from a deck of 52 cards. What is the probability of getting a heart?
(A) 1/4
(B) 1/13
(C) 1/26
(D) 1/52A box contains 10 balls, of which 6 are red and 4 are blue. A ball is drawn at random. What is the probability of getting a red ball or a blue ball?
(A) 1/2
(B) 3/5
(C) 7/10
(D) 11/10A bag contains 5 white balls, 3 black balls, and 2 red balls. A ball is drawn at random. What is the probability of getting a white ball or a black ball?
(A) 1/2
(B) 3/5
(C) 7/10
(D) 11/10A coin is tossed 5 times. What is the probability of getting 3 heads and 2 tails?
(A) 1/32
(B) 1/16
(C) 5/32
(D) 10/32A bag contains 5 red balls, 3 black balls, and 2 white balls. Two balls are drawn at random. What is the probability of getting 2 red balls?
(A) 1/10
(B) 3/20
(C) 1/15
(D) 1/30A die is rolled 6 times. What is the probability of getting at least 5 sixes?
(A) 1/64
(B) 5/64
(C) 15/64
(D) 63/64A card is drawn from a deck of 52 cards. What is the probability of getting a spade or a heart?
(A) 1/4
(B) 1/13
(C) 1/26
(D) 1/52
I hope these MCQs are helpful!