Data Interpretation or DI refers to the implementation of procedures through which data is reviewed for the purpose of arriving at an inference. Data can be obtained from multiple sources e.g. data from running of industries, census Population data etc. Interpreting data requires analyzing data to infer information from it in order to answer questions. Data can be provided in a number of formats viz: Bars, tables, line graphs, Pie graphs.
Bar Graphs
A bar graph or bar chart represents explicit data with rectangular bars. The heights and lengths of these bar graphs are proportional to the values of data they represent. There are two types of bar graph, one is called horizontal bar graph and other is called vertical bar graph. The important thing to remember is that the longer the bar, the greater its value. Bar graphs made up of two axis, one is called x- axis and other is called y- axis. In a horizontal bar graph, y-axis shows the data categories and x- axis shows the scale. In vertical bar graph, x-axis shows the data categories and y-axis shows the scale. In a nutshell, we can compare easily different sets of data between different groups with the help of bar graph.
Tables
In tables, data is described in the form of rows and columns. In DI table’s questions, we are required to read data from table/tables analyze the data and answer the questions asked on the basis of the given data.
DI Questions based on Tables are very common in competitive exams. Rows and Columns of tables consist of various types of data like income of company, expenditure on various items, and marks of Applicants and so on. First column and row of tables represent the titles. Level of Questions in Tables may be lower or higher in comparison of other graphs form, depending on given data in the table and the way,questions are framed.
Line Graphs
A line graph basically is used to visualize values over a certain time period. It is basically used to change over time as various points of data connected by straight line on two axes. It helps to determine the relationship between two sets of values; and also one data set is always dependent on the other set. In many competitive exams, you will see various questions based on line chart problems, in which you are supposed to analyze the data and then answer them.
Pie Charts
Pie charts are circular shaped graphs which are divided into sectors to represent numerical proportions. In a pie chart, the central angle of a particular sector is proportional to the quantity it represents. In other words, we can say a Pie Chart resembles a Pie in which a circle is cut in various sized sectors from center to the boundary. In simple words, the bigger the sector, the higher the proportion.
Bar graphs
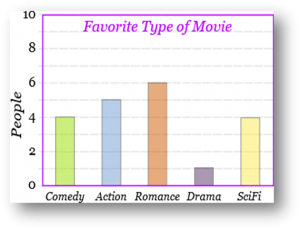
A Bar Graph (also called Bar Chart) is a graphical display of data using bars of different heights.
Imagine you just did a survey of your friends to find which kind of movie they liked best:
| Table: Favourite Type of Movie | ||||
| Comedy | Action | Romance | Drama | SciFi |
| 4 | 5 | 6 | 1 | 4 |
We can show that on a bar graph like this:
Pie charts
The formula to determine the angle of a sector in a circle graph is:
Angle of sector = Frequency of data / Total frequency × 360°
Example:
Imagine you survey your friends to find the kind of movie they like best:
| Table: Favourite Type of Movie | ||||
| Comedy | Action | Romance | Drama | SciFi |
| 4 | 5 | 6 | 1 | 4 |
You can show the data by this Pie Chart:
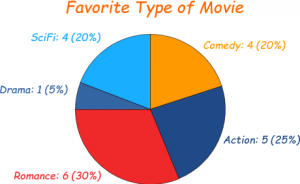
It is a really good way to show relative sizes: it is easy to see which movie types are most liked, and which are least liked, at a glance.
Next, divide each value by the total and multiply by 100 to get a percent:
| Comedy | Action | Romance | Drama | SciFi | TOTAL |
| 4 | 5 | 6 | 1 | 4 | 20 |
| 4/20 = 20% | 5/20 = 25% | 6/20 = 30% | 1/20 = 5% | 4/20 = 20% | 100% |
Now to figure out how many degrees for each “pie slice” (correctly called a sector). A Full Circle has 360 degrees, so we do this calculation:
| Comedy | Action | Romance | Drama | SciFi | TOTAL |
| 4 | 5 | 6 | 1 | 4 | 20 |
| 20% | 25% | 30% | 5% | 20% | 100% |
| 4/20 × 360° = 72° | 5/20 × 360° = 90° | 6/20 × 360° = 108° | 1/20 × 360° = 18° | 4/20 × 360° = 72° | 360° |
,
Data collection is the process of gathering and measuring information on variables of interest, in an established systematic fashion that enables one to answer stated research questions, test hypotheses, and evaluate outcomes. The data collection component of research is common to all fields of study including physical and social sciences, humanities, business, etc.
Data analysis is a process of inspecting, cleaning, transforming, and modeling data with the goal of discovering useful information, informing conclusions, and supporting decision-making. Data analysis has multiple facets and approaches, encompassing diverse techniques under a variety of names, in different business, science, and social science domains.
Data interpretation is the process of analyzing data and drawing conclusions from it. It is the process of understanding the meaning of data and how it can be used to answer questions or make decisions. Data interpretation can be done by looking at the data itself, by comparing it to other data, or by using statistical methods.
Statistical data is data that is collected and analyzed using the principles of statistics. Statistical data can be used to describe a population, to make inferences about a population, or to test hypotheses.
The collection of statistical data is the process of gathering data that can be used to make inferences about a population. The data can be collected from a variety of sources, including surveys, interviews, and observations.
The interpretation of statistical data is the process of making sense of the data and drawing conclusions from it. The data can be interpreted in a variety of ways, depending on the purpose of the study.
The appreciation of statistical data is the ability to understand and appreciate the value of statistical data. Statistical data can be used to make informed decisions, to understand the world around us, and to solve problems.
Data collection is the first step in the research process. It is important to collect data that is relevant to the research question and that is accurate and reliable. There are a variety of methods for collecting data, including surveys, interviews, observations, and experiments.
Data analysis is the process of organizing and summarizing data. It is important to use appropriate statistical methods to analyze the data. The results of the data analysis should be presented in a clear and concise way.
Data interpretation is the process of drawing conclusions from the data. It is important to consider the limitations of the data and to avoid making over-generalizations. The results of the data interpretation should be presented in a clear and concise way.
The collection, interpretation, and appreciation of statistical data are essential skills for anyone who wants to make informed decisions about the world around them. By understanding how to collect, analyze, and interpret data, we can better understand the world around us and make better decisions.
Here are some examples of how statistical data can be used:
- To describe a population: For example, a survey of 1,000 randomly selected adults in the United States could be used to describe the population of the United States in terms of age, gender, race, and ethnicity.
- To make inferences about a population: For example, if a survey of 1,000 randomly selected adults in the United States finds that 60% of adults support a certain policy, then we can infer that about 60% of the population of the United States supports that policy.
- To test hypotheses: For example, a study could be conducted to test the hypothesis that there is a relationship between smoking and lung cancer. The study would collect data on the smoking habits and lung cancer status of a group of people, and then use statistical methods to test the hypothesis.
Statistical data can be collected from a variety of sources, including surveys, interviews, observations, and experiments. Surveys are a common way to collect data from a large number of people. Interviews are a way to collect data from a smaller number of people in more detail. Observations are a way to collect data by watching people or things. Experiments are a way to collect data by manipulating variables and observing the results.
Once data has been collected, it needs to be analyzed. Statistical methods can be used to analyze data and to draw conclusions from it. Some common statistical methods include descriptive statistics, inferential statistics, and hypothesis testing. Descriptive statistics are used to describe data. Inferential statistics are used to make inferences about a population based on data from a sample. Hypothesis testing is used to test hypotheses about a population.
The results of data analysis should be presented in a clear and concise way. The results can be presented in tables, graphs, or charts. The results should be interpreted carefully, and the limitations of the data should be considered.
The collection, interpretation, and appreciation of statistical data are essential skills for anyone who wants to make informed decisions about the world around them. By understanding how to collect, analyze, and interpret data, we can better understand the world around us and make better decisions.
Here are some frequently asked questions and short answers about data collection, analysis, interpretation, and appreciation of statistical data:
What is data collection?
Data collection is the process of gathering and measuring information on variables of interest, in an established systematic fashion that enables one to answer stated research questions, test hypotheses, and evaluate outcomes. The data collection component of research is common to all fields of study including physical and social sciences, humanities, business, etc.
What is data analysis?
Data analysis is the process of inspecting, cleaning, transforming, and modeling data with the goal of discovering useful information, informing conclusions, and supporting decision-making. Data analysis has multiple facets and approaches, encompassing diverse techniques under a variety of names, in different business, science, and social science domains.
What is data interpretation?
Data interpretation is the process of analyzing data and drawing conclusions from it. It is a critical part of the research process, as it allows researchers to understand what their data means and to make inferences about the world. Data interpretation can be done in a variety of ways, depending on the type of data and the research question.
What is the importance of data collection, analysis, interpretation, and appreciation of statistical data?
Data collection, analysis, interpretation, and appreciation of statistical data are all important parts of the research process. Data collection allows researchers to gather information about the topic they are studying. Data analysis allows researchers to make sense of the data they have collected. Data interpretation allows researchers to draw conclusions from the data they have analyzed. And appreciation of statistical data allows researchers to understand the limitations of data and to communicate their findings effectively.
What are some common challenges in data collection, analysis, interpretation, and appreciation of statistical data?
Some common challenges in data collection include:
- Selecting the right data: Researchers need to make sure that they are collecting data that is relevant to their research question.
- Collecting accurate data: Researchers need to make sure that the data they collect is accurate and reliable.
- Managing the data: Researchers need to have a system in place for managing the data they collect.
Some common challenges in data analysis include:
- Choosing the right analytical methods: Researchers need to choose analytical methods that are appropriate for their data and their research question.
- Interpreting the results: Researchers need to be able to interpret the results of their data analysis.
- Communicating the results: Researchers need to be able to communicate the results of their data analysis effectively.
Some common challenges in data interpretation include:
- Making sense of the data: Researchers need to be able to make sense of the data they have collected and analyzed.
- Drawing conclusions: Researchers need to be able to draw conclusions from the data they have analyzed.
- Communicating the conclusions: Researchers need to be able to communicate their conclusions effectively.
Some common challenges in appreciation of statistical data include:
- Understanding the limitations of data: Researchers need to understand the limitations of data and how they can affect the results of their research.
- Communicating the limitations: Researchers need to be able to communicate the limitations of their data and their research effectively.
What are some tips for overcoming these challenges?
Some tips for overcoming challenges in data collection include:
- Planning carefully: Researchers need to plan carefully for data collection.
- Using reliable sources: Researchers need to use reliable sources for data collection.
- Pilot testing: Researchers should pilot test their data collection methods before using them in their research.
Some tips for overcoming challenges in data analysis include:
- Choosing the right analytical methods: Researchers need to choose analytical methods that are appropriate for their data and their research question.
- Using appropriate Software: Researchers need to use appropriate software for data analysis.
- Getting help: Researchers should get help from experts if they need it.
Some tips for overcoming challenges in data interpretation include:
- Making sense of the data: Researchers need to make sense of the data they have collected and analyzed.
- Drawing conclusions: Researchers need to be able to draw conclusions from the data they have analyzed.
- Communicating the conclusions: Researchers need to be able to communicate their conclusions effectively.
Some tips for overcoming challenges in appreciation of statistical data include:
- Understanding the limitations of data: Researchers need to understand the limitations of data and how they can affect the results of their research.
- Communicating the limitations: Researchers need to be able to communicate the limitations of their data and their research effectively.
Which of the following is not a step in the data analysis process?
(A) Data collection
(B) Data cleaning
(C) Data analysis
(D) Data interpretation
(E) Data presentationWhich of the following is not a type of data analysis?
(A) Descriptive statistics
(B) Inferential statistics
(C) Predictive analytics
(D) Data mining
(E) Data visualizationWhich of the following is not a tool for data analysis?
(A) Spreadsheets
(B) Databases
(C) Statistical software
(D) Data visualization software
(E) All of the above are tools for data analysis.Which of the following is not a benefit of data analysis?
(A) It can help you to make better decisions.
(B) It can help you to identify trends.
(C) It can help you to understand your data.
(D) It can help you to communicate your findings.
(E) All of the above are benefits of data analysis.Which of the following is not a challenge of data analysis?
(A) Data can be messy.
(B) Data can be incomplete.
(C) Data can be biased.
(D) Data can be difficult to understand.
(E) All of the above are challenges of data analysis.Which of the following is not a type of data visualization?
(A) Bar charts
(B) Line graphs
(C) Pie charts
(D) Scatter plots
(E) All of the above are types of data visualization.Which of the following is not a benefit of data visualization?
(A) It can help you to communicate your findings.
(B) It can help you to identify trends.
(C) It can help you to understand your data.
(D) It can help you to make better decisions.
(E) All of the above are benefits of data visualization.Which of the following is not a challenge of data visualization?
(A) Data visualization can be difficult to do well.
(B) Data visualization can be misleading.
(C) Data visualization can be time-consuming.
(D) Data visualization can be expensive.
(E) All of the above are challenges of data visualization.Which of the following is not a type of statistical test?
(A) t-test
(B) ANOVA
(C) Chi-square test
(D) Regression analysis
(E) All of the above are types of statistical tests.Which of the following is not a benefit of statistical testing?
(A) It can help you to identify relationships between variables.
(B) It can help you to make inferences about the population from the sample.
(C) It can help you to determine whether the results of your study are statistically significant.
(D) It can help you to control for confounding variables.
(E) All of the above are benefits of statistical testing.Which of the following is not a challenge of statistical testing?
(A) Statistical tests can be difficult to understand.
(B) Statistical tests can be misused.
(C) Statistical tests can be expensive.
(D) Statistical tests can be time-consuming.
(E) All of the above are challenges of statistical testing.Which of the following is not a type of research design?
(A) Experimental design
(B) Quasi-experimental design
(C) Non-experimental design
(D) Cross-sectional design
(E) All of the above are types of research designs.Which of the following is not a benefit of experimental design?
(A) It allows you to control for confounding variables.
(B) It allows you to make causal inferences.
(C) It is the most rigorous type of research design.
(D) It is the most common type of research design.
(E) All of the above are benefits of experimental design.Which of the following is not a challenge of experimental design?
(A) Experimental designs can be difficult to implement.
(B) Experimental designs can be expensive.
(C) Experimental designs can be time-consuming.
(D) Experimental designs can be unethical.
(E) All of the above are challenges of experimental design.Which of the following is not a type of qualitative research?
(A) Grounded theory
(B) Phenomenology
(C) Ethnography
(D) Case study
(E) All of the above are types of qualitative research.Which of the following is