The word “average” is used in everyday life to describe where the middle number of a data set is. It’s the typical number you would expect to find in a series of numbers. In statistics, the average is called the “arithmetic mean,” usually just shortened to the mean. Both the average and the mean use the same formula:
avg = total sum of all the numbers / number of items in the set.
Example
You earned $129, $139, $155 and $176 over the last 4 weeks. What is your average pay?
Add up all of the numbers in the set. $129 + $139 + $155 + $176 = $599.
Divide Step 1 by the total number of items in the set. There are 4 items in the set, so $599 / 4 = $149.75.
In Probability and statistics, you’ll see the following formula used:
The arithmetic mean is the simplest and most widely used measure of a mean, or average. It simply involves taking the sum of a group of numbers, then dividing that sum by the count of the numbers used in the series.
For exampletake 34, 44, 56 and 78. The sum is 212. The arithmetic mean is 212 divided by four, or 53.
The arithmetic mean maintains its place in finance, as well. For example, mean earnings estimates typically are an arithmetic mean. Say you want to know the average earnings expectation of the 16 analysts covering a particular stock. Simply add up all the estimates and divide by 16 to get the arithmetic mean.
The same is true if you want to calculate a stock’s average closing price during a particular month. Say there are 23 trading days in the month. Simply take all the prices, add them, up and divide by 23 to get the arithmetic mean.
The arithmetic mean is simple, and most people with even a little bit of finance and math skill can calculate it. It’s also a useful measure of central tendency, as it tends to provide useful results, even with large groupings of numbers.
Geomatric mean
The Geometric mean is defined as the nth square root of the product of n distinct data values. That is, consider, n data values as x1, x2, …, xn the geometric mean is given by,
Moreover, geometric mean is considered as a special type of average. Also, the value of geometric is less than the arithmetic mean and is considered as one of the measures of central tendency.
Also, if the n data values has repeated values x1, x2,…, xm with frequencies f1,f2,…,fm, then the geometric mean is given by,
The other formula to calculate the geometric mean is,
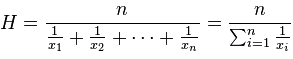
Harmonic mean
The harmonic mean is a very specific type of average. It’s generally used when dealing with averages of units, like speed or other rates and ratios.
formula is:
Example: What is the harmonic mean of 1,5,8,10?
Add the reciprocals of the numbers in the set: 1/1 + 1/5 + 1/8 + 1/10 = 1.425
Divide the number of items in the set by your answer.
There are 4 items in the set, so: 4 / 1.425 = 2.80702
Relation between arithmetic geometric and harmonic means
Let us consider two numbers x and y. Then, if x, a, y forms an arithmetic progression, then this ‘a’ is termed as the arithmetic mean. Likewise, if this sequence of x, a, y forms a geometric progression then it is termed a geometric mean and same goes for harmonic mean. Mathematically, the three means can be described as under:
Arithmetic Mean: For two numbers ‘a’ and ‘b’, the arithmetic mean is defined as:
(a+b)/2
√ab
Geometric Mean: Unlike arithmetic mean, the geometric mean takes into account the product of the numbers. For two numbers ‘a’ and ‘b’, the geometric mean is defined as
Harmonic Mean: The harmonic mean of two numbers ‘a’ and ‘b’ is defined as
If A.M denotes the arithmetic mean, G.M denotes the geometric mean and H.M, the harmonic mean, then the relationship between the three is given by:
A.M × G.M = H.M2
Their relationship can also be illustrated using the inequality:
A ≥ G ≥ H
,
In statistics, an average is a central or typical value of a set of numbers. It is calculated by adding all the numbers in the set and then dividing by the number of numbers in the set. There are many different types of averages, each with its own advantages and disadvantages.
The mean is the most common type of average. It is calculated by adding all the numbers in the set and then dividing by the number of numbers in the set. The mean is easy to calculate and understand, but it can be sensitive to outliers, which are data points that are very different from the rest of the data.
The Median is the middle value in a set of numbers. To find the median, you first need to order the numbers from least to greatest. If the number of numbers in the set is even, the median is the average of the two middle numbers. If the number of numbers in the set is odd, the median is the middle number. The median is less sensitive to outliers than the mean, but it can be more difficult to calculate.
The mode is the most common value in a set of numbers. To find the mode, you need to count how many times each number appears in the set. The number that appears the most times is the mode. The mode is easy to calculate, but it can be misleading if there are multiple modes in the set.
The weighted mean is a type of average that takes into account the importance of each number in the set. To calculate the weighted mean, you first need to multiply each number in the set by its weight. Then, you add all the products and divide by the sum of the weights. The weighted mean is useful when you want to average numbers that have different levels of importance.
The harmonic mean is a type of average that is calculated by taking the reciprocal of the sum of the reciprocals of the numbers in the set. The harmonic mean is less commonly used than other types of averages, but it can be useful when you are interested in the average rate of change.
The geometric mean is a type of average that is calculated by taking the product of the numbers in the set and then taking the root of the product. The geometric mean is less commonly used than other types of averages, but it can be useful when you are interested in the average Growth rate.
The median absolute deviation is a type of average that is calculated by finding the median of the absolute values of the differences between the numbers in the set and the mean. The median absolute deviation is less sensitive to outliers than the standard deviation, but it can be more difficult to calculate.
The quartile deviation is a type of average that is calculated by finding the difference between the third quartile and the first quartile. The quartile deviation is less commonly used than other types of averages, but it can be useful when you are interested in the spread of the data.
The interquartile range is a type of average that is calculated by finding the difference between the third quartile and the first quartile. The interquartile range is a measure of the spread of the data that is less sensitive to outliers than the standard deviation.
The standard deviation is a type of average that is calculated by taking the square root of the Variance. The standard deviation is a measure of the spread of the data that is commonly used in statistics.
The variance is a type of average that is calculated by taking the sum of the squared deviations from the mean and then dividing by the number of numbers in the set. The variance is a measure of the spread of the data that is less commonly used than the standard deviation.
The range is a type of average that is calculated by finding the difference between the largest and smallest numbers in the set. The range is a simple measure of the spread of the data, but it can be misleading if there are outliers in the set.
Skewness is a measure of the symmetry of the data. A distribution is said to be skewed if it is not symmetrical. There are two types of skewness: positive skewness and negative skewness. A distribution is said to be positively skewed if the tail on the right side of the distribution is longer than the tail on the left side. A distribution is said to be negatively skewed if the tail on the left side of the distribution is longer than the tail on the right side.
Kurtosis is a measure of the peakedness of the data. A distribution is said to be leptokurtic if it is more peaked than a normal distribution. A distribution is said to be platykurtic if it is less peaked than a normal distribution. A distribution is said to be mesokurtic if it has the same peakedness as a normal distribution.
In conclusion, there are many different types of averages, each with its own advantages and disadvantages. The type of average that you use will depend on the type of data that you are analyzing.
What is the median? The median is the middle value in a set of numbers. To find the median, order the numbers from least to greatest and then find the number in the middle. If there is an even number of numbers, the median is the average of the two middle numbers.
What is the mode? The mode is the most frequent number in a set of numbers. To find the mode, count how many times each number appears in the set. The number that appears the most times is the mode.
What is the range? The range is the difference between the largest and smallest numbers in a set of numbers. To find the range, subtract the smallest number from the largest number.
What is the standard deviation? The standard deviation is a measure of how spread out a set of numbers is. To calculate the standard deviation, first find the mean of the set of numbers. Then, subtract the mean from each number and square the result. Add up the squared differences and divide by the number of numbers in the set. Finally, take the square root of the result.
What is the variance? The variance is a measure of how spread out a set of numbers is. To calculate the variance, first find the mean of the set of numbers. Then, subtract the mean from each number and square the result. Add up the squared differences and divide by the number of numbers in the set.
What is the interquartile range? The interquartile range is a measure of the spread of a data set. It is calculated by finding the median of the lower half of the data and the median of the upper half of the data. The interquartile range is equal to the difference between these two values.
What is the coefficient of variation? The coefficient of variation is a measure of how spread out a set of numbers is relative to its mean. To calculate the coefficient of variation, divide the standard deviation by the mean. The coefficient of variation is often expressed as a Percentage.
What is the z-score? A z-score is a measure of how far a value is from the mean in terms of standard deviations. To calculate the z-score, subtract the mean from the value and then divide by the standard deviation.
What is the normal distribution? The normal distribution is a probability distribution that is often used to model real-world data. It is characterized by a bell-shaped curve, with the mean, median, and mode all being equal.
What is the t-distribution? The t-distribution is a probability distribution that is used to estimate the mean of a Population when the sample size is small. It is similar to the normal distribution, but it has heavier tails.
What is the F-distribution? The F-distribution is a probability distribution that is used to compare the variances of two populations. It is often used in ANOVA tests.
What is the chi-square distribution? The chi-square distribution is a probability distribution that is used to test goodness of fit and independence. It is often used in hypothesis tests.
What is the p-value? The p-value is a measure of the evidence against the null hypothesis. It is calculated by finding the probability of obtaining the observed results or more extreme results if the null hypothesis were true.
What is a confidence interval? A confidence interval is a range of values that is likely to contain the true value of a population parameter. It is calculated by finding the mean of a sample and then adding and subtracting the margin of error to the mean.
What is a hypothesis test? A hypothesis test is a statistical test that is used to determine whether there is evidence to reject the null hypothesis. The null hypothesis is the hypothesis that there is no difference between two groups or that there is no relationship between two variables.
What is a correlation coefficient? A correlation coefficient is a measure of the strength of the linear relationship between two variables. It is calculated by finding the covariance of the two variables and then dividing by the product of their standard deviations.
What is a regression line? A regression line is a line that is used to describe the relationship between two variables. It is calculated by finding the mean of the dependent variable and then adding and subtracting the slope of the line to the mean.
What is a multiple regression line? A multiple regression line is a line that is used to describe the relationship between two or more variables. It is calculated by finding the mean of the dependent variable and then adding and subtracting the slopes of the lines to the mean.
What is a logistic regression line? A logistic regression line is a line that is used to describe the relationship between a binary variable and one
Sure, here are some multiple choice questions without mentioning the topic of averages:
The sum of the deviations from the mean is always equal to: (A) 0 (B) 1 (C) 2 (D) 3
The median is the middle value in a set of data. If a set of data has an even number of values, the median is the average of the two middle values. True or False?
The mode is the most frequent value in a set of data. True or False?
The range is the difference between the largest and smallest values in a set of data. True or False?
The standard deviation is a measure of how spread out the values in a set of data are. True or False?
The variance is a measure of how spread out the values in a set of data are, but it is not as sensitive to outliers as the standard deviation. True or False?
A box plot is a graphical representation of a set of data that shows the median, the first and third quartiles, and the minimum and maximum values. True or False?
A histogram is a graphical representation of a set of data that shows the frequency of each value in the data set. True or False?
A Pie chart is a graphical representation of a set of data that shows the relative proportions of each value in the data set. True or False?
A scatter plot is a graphical representation of the relationship between two variables. True or False?